Graphic Design · Data Visualisation · Interactive Experience


Central Saint Martins Graduate Show 2024
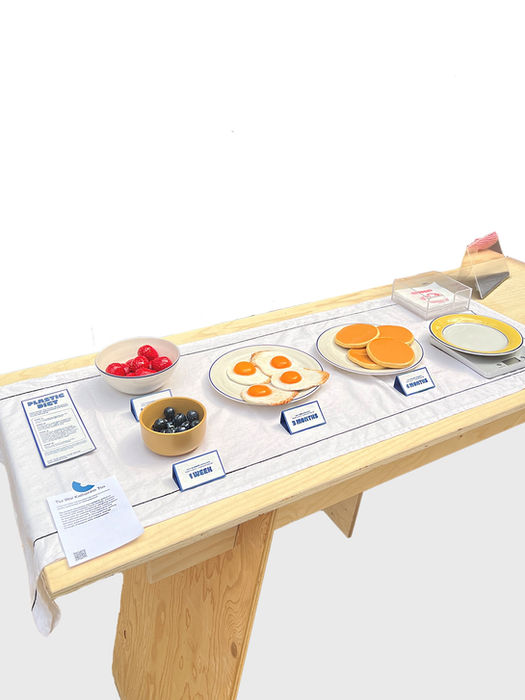
This project is showcased at the Central Saint Martins Shows 2024. Visitors can assemble their own plastic meals and gain insight into their average microplastic consumption over different periods of time.
How can data visualisation be used to increase public awareness of microplastics?
My project visualises microplastic pollution by using hyper-realistic food models. Viewers interact with these models by weighing them to discover an individual’s plastic consumption over different periods. This highlights the pervasive presence of microplastics, aiming to raise awareness and inspire change through engaging data visualisation.


This critical report follows a project exploring how data visualization can be used to increase public awareness of microplastics. Designed to resemble a restaurant menu, the report visually reinforces the theme of microplastics in our food system. It delves into the role of data visualization in environmental communication, examining its effectiveness in conveying complex issues to the public. By outlining the research process, design approach, and creative position as a designer, the report offers insights into how visual storytelling can engage audiences and drive awareness of microplastic pollution.


